


The Disparity Index: Trading, Life, and Business Lessons from a Powerful Indicator + Prep for Thursday, March 23rd, 2023
Prep for tomorrow and review of today.

Welcome to tonight's post, where we will explore a topic that is highly relevant to the world of trading, as well as to our lives and businesses. As traders, we are always looking for ways to improve our performance, manage risk, and make better decisions. But what about the broader context in which we operate? How can the lessons and insights from our trading journey apply to other areas of our lives and work?
In tonight's post, we will delve into the concept of the Disparity Index, a technical analysis indicator that measures the relative difference between an asset's price and a chosen moving average. We will explore how this tool can help traders identify trends, turning points, and symmetrical extremes, and provide actionable tips for incorporating it into your trading strategy.
But we will not stop there. We will also examine how the Disparity Index can offer insights and lessons beyond the trading world, from technology to parenting, sports, development, management, and more. Through real-world examples and actionable tips, we will show you how to apply the power of the Disparity Index to your life and business, and help you become a more effective and informed trader and person.
So sit back, grab a cup of coffee, and join us on this journey of discovery and growth. Let's dive into the world of the Disparity Index, and see what it can teach us about trading, business, and life.

Quick housekeeping. We are going to out of pocket most of the first week in April and there will be no posts or updates during that time period.
As you may have seen we have worked live prep to our morning routine and intend to continue again tomorrow morning starting around 5:45 US CST Live prep. During our prep we walk through our prep zones for the day including $SPY, $QQQ, $VIX, $SVXY, $ES_F, $NQ_F, $RTY_F, $YM_F along with $CL_F and $GC_F.
Mastering the Expected Move: How to Use This Little-Known Concept to Gain an Edge in Trading
Introduction: Are you looking for a technical analysis tool that can help you identify trends, turning points, and symmetrical extremes in the markets? Look no further than the Disparity Index. This powerful indicator measures the relative difference between an asset's price and a chosen moving average, and can offer valuable insights and lessons for traders, businesspeople, and anyone interested in improving their decision-making skills.
In this post, we will explore the world of the Disparity Index, and show you how it can help you become a more effective and informed trader, entrepreneur, and person. We will provide prescient points for traders, actionable tips for incorporating the Disparity Index into your trading strategy, and real-world examples of its power in action. But we will not stop there. We will also examine how the Disparity Index can offer insights and lessons beyond the trading world, and help you navigate the challenges and opportunities of life and business with more clarity and confidence. So join us on this journey of discovery and growth, and let's explore the world of the Disparity Index together.
Section 1: What are Symmetrical Extremes aka Disparity Index
If you're a trader, you know that success in the markets requires a keen understanding of trends, patterns, and turning points. The Disparity Index can help you in this regard by measuring the difference between an asset's price and a chosen moving average, and providing a visual representation of the asset's relative strength or weakness. Here are some prescient points to consider:
The Disparity Index can help you identify overbought and oversold conditions. When the Disparity Index is above a certain threshold, it suggests that the asset is overbought and due for a price correction. Conversely, when the Disparity Index is below a certain threshold, it suggests that the asset is oversold and due for a price rebound.
The Disparity Index can help you confirm trends and turning points. By comparing the asset's price to a chosen moving average, the Disparity Index can help you confirm whether a trend is intact or whether a turning point is likely to occur.
The Disparity Index can help you set stop-loss orders. By monitoring the Disparity Index, you can set stop-loss orders at key levels, and minimize your losses in case of a sudden price reversal.
The Disparity Index can help you filter out noise and focus on the most relevant information. By providing a clear and objective measure of an asset's relative strength or weakness, the Disparity Index can help you filter out noise and focus on the most important signals in the markets.
The Disparity Index can be customized to your trading style and preferences. You can choose different moving averages, timeframes, and thresholds, depending on your trading style and risk tolerance.
Actionable Tips: Below are some actionable tips:
Always check the expected move before trading earnings: The expected move is a crucial metric for traders to consider when trading earnings. Always check the expected move and plan your trades accordingly.
Use the expected move to set profit targets: Traders can use the expected move to set profit targets for their trades. This can help traders lock in gains and reduce the risk of sudden price reversals.
Be mindful of the stock's history: When trading with the expected move, it's essential to consider the stock's history. If the stock has a history of large price swings, the expected move may not be as accurate.
Combine the expected move with other technical indicators: Traders can use the expected move in conjunction with other technical indicators to confirm signals and reduce false alarms.
Consider the impact of news and events: News and events can significantly impact a stock's price movements. When trading with the expected move, consider the impact of news and events on the stock's price.
Monitor the expected move regularly: The expected move can change over time as new information becomes available. Traders should monitor the expected move regularly and adjust their trading strategies accordingly.
Conclusion:
In conclusion, the disparity index is a powerful indicator that can provide valuable insights for traders looking to maximize their profits and minimize their risks. By comparing the current price of an asset to its historical average, traders can gain a better understanding of market trends and identify potential opportunities.
From using the disparity index to track symmetrical extremes to incorporating it into your overall trading strategy, there are many ways to leverage this indicator for success. And with the real-world examples and actionable tips provided in this article, you can start incorporating the disparity index into your trading strategy today.
But there is still much more to learn and explore when it comes to trading indicators and techniques. So stay tuned for more insights and strategies from us in the future, as we continue to explore the world of trading and help you become a better trader.
Related to these book recommendations, we would suggest checking out an Audible 30 day trial on Amazon. Yes we know it may sound cheesy and yes we are an affiliate there, but having now used the past month+ on our evening walks it’s been a game changer. We’ve been using audible to listen to various books and it’s been really fruitful.
As we’ve noted before we are building this from the ground up and our intention is to continuously add and improve. As always, we recommend doing your own research and consulting with a financial advisor before making any investment decisions, as nothing we say or suggest should be taken as a recommendation to buy, sell, or hedge any financial instruments (full disclosure here).
Tomorrow’s prep / high interest zones:
Next are the key tickers and price zones broken into categories of Breadth, Overall, Meme, Forex / AG futures. Further below you can find the section for Expected moves (aka cheat codes) and the symmetrical extremes. If you need a summary/reminder of what these zones mean, see our earlier post.
High interest tickers & zones:
Breadth
SVXY [61.69 - 61.22]
ES_F [3941.00 - 3924.50]
RTY_F [1786.8 - 1775.0]
FAZ [22.68 - 22.40]
MSFT [270.00 - 268.97], [264.69 - 263.43]
SOXL [15.75 - 15.49]
QQQ [315.42 - 314.56], [308.15 - 307.39]
NQ_F [12700.00 - 12650.25], [12458.00 - 12407.75]
TSLA [198.11 - 196.77]
CL_F [69.14 - 68.41]
AMZN [96.46 - 96.00]
Overall
ADI [185.00 - 184.58]
UBSI [34.50 - 34.19]
NKE [122.81 - 121.99]
SSB [69.80 - 69.17]
MTB [124.80 - 124.44]
KRTX [189.00 - 187.62], [177.81 - 176.42]
SPOT [131.93 - 131.33]
MCK [338.17 - 337.91]
KHC [38.25 - 38.15]
KMB [130.09 - 129.92]
LNW [56.43 - 56.33]
TSM [93.02 - 92.90]
UFPI [79.68 - 79.39]
VICI [29.48 - 29.46]
MUSA [256.81 - 255.23]
EXPO [88.59 - 88.04]
PAYX [106.26 - 105.51]
CVX [155.30 - 154.58]
RHP [84.79 - 84.48]
CB [194.31 - 193.53]
FOREX Futes (these have now rolled to June contract)
6N_F [0.63135 - 0.62955]
6B_F [1.2083 - 1.2078]
AG Futes (these have now rolled to June contract)
None for tomorrow.
Meme
GME [23.48 - 23.11]

Expected move levels for tomorrow
Need to understand more about the Expected Move? Check our earlier post.

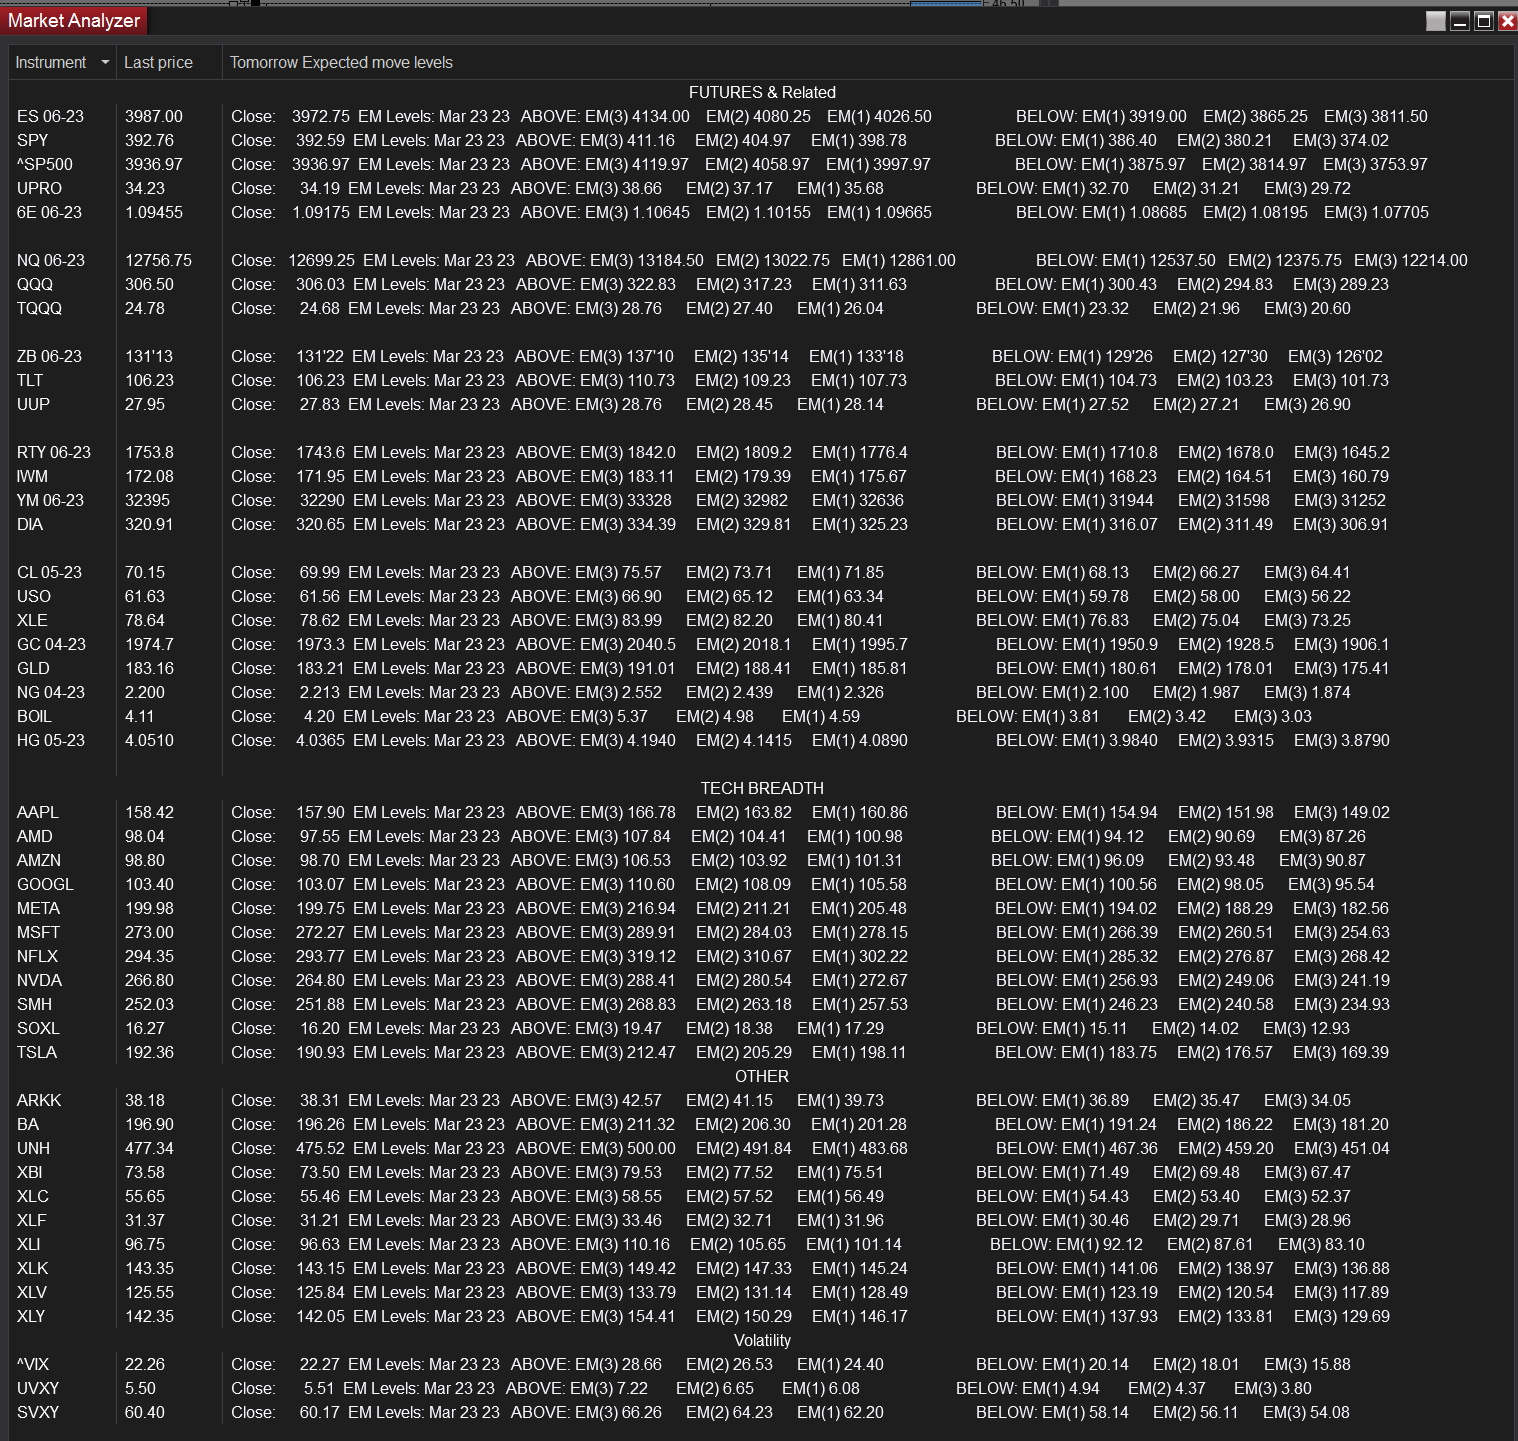
Symmetrical extreme readings
In a future post we will delve further into what these mean, but you can also check out things such as Disparity Index to understand some of the basics.

Today’s review
Moved this below prep as it’s probably less serving for most folks.
Journaling side
We only got off a few trades given today was FOMC. The overall gist for today is our Rating is a 1. Though we have slacked here the past few days we’ve been focused elsewhere and are still mentally stacking these to detail later.
That’s all for tonight folks…just a reminder, our goal is to constantly improve and refine our proprietary AI system + this content. These tools analyze hundreds of tickers to identify high-interest areas based on multiple areas of confluence evidence. As always, we recommend doing your own research and consulting with a financial advisor before making any investment decisions, as nothing we say or suggest should be taken as a recommendation to buy, sell, or hedge any financial instruments (please read our disclaimer ).
Tools / Affiliates / etc.
Affiliates:
We are an affiliate with ApexTraderFunding.
We are an affiliate with TastyWorks.
Tools used/shown:
ThinkOrSwim “Has no interest, affiliation with the owner, developer, or provider of the products or services described herein, or any interest, ownership or otherwise, in any such product or service, or endorses, recommends or approves any such product or service.”
“NinjaTrader® is a registered trademark of NinjaTrader Group, LLC. No NinjaTrader company has any affiliation with the owner, developer, or provider of the products or services described herein, or any interest, ownership or otherwise, in any such product or service, or endorses, recommends or approves any such product or service.”
General housekeeping:
We will never DM you!…We will never offer to trade for you or trade your money.
Our only accounts at this time are Twitter and YouTube.
Intellectual Property
The content contained within this newsletter, including financial indicators, thoughts, images, and other materials, is the intellectual property of Midnitebrands. This content is protected by copyright and trademark laws and may not be reproduced, distributed, transmitted, displayed, published, or broadcast without the prior written permission of Midnitebrands.
Any unauthorized use of this content is strictly prohibited. By accessing and using this newsletter, you agree to respect the intellectual property rights of Midnitebrands and to not use any of the contained content for any commercial or non-commercial purposes without the express written permission of Midnitebrands. You may not publish, transmit, transfer, sell, reproduce, upload, post, perform, display, create derivative works from, or in any way exploit such Content or distribute it in any way to any other computer, server, website or other medium for publication or distribution or for any commercial purpose. Any attempt to do so may result in the immediate termination of your account membership with Midnitebrands newsletter, prohibition to use the Content and any other materials provided, and further legal action.
In addition to respecting the intellectual property rights of Midnitebrands as stated above, you also agree not to disassemble, decompile, reverse engineer, or otherwise attempt to derive the source code or underlying ideas or algorithms of any of the software or technology used in connection with this newsletter or provided software. You further agree not to modify, translate, or create derivative works based on any of the software or technology used in connection with this newsletter. Any unauthorized use of the software or technology used in connection with this newsletter is strictly prohibited and may result in the immediate termination of your membership with Midnitebrands, and further legal action.
Disclaimer
Overall:
Our newsletter and thoughts in general are meant to provide educational and informational resources related to the financial markets and other topics. However, none of the information provided by our company should be considered investment advice or a recommendation to buy or sell any financial instrument. It is important to note that trading in the financial markets carries a high level of risk and may not be suitable for all investors. We do not provide personalized investment advice or recommendations, and it is up to the individual to make their own investment decisions based on their own research and due diligence. We strongly advise all individuals to consult with a financial advisor or professional before making any investment decisions. The team at Midnitebrands, are not responsible for any investment decisions or actions taken by our readers or clients as a result of the information provided. Past performance is not necessarily indicative of future results, and we do not guarantee any specific outcome or profit from using our information or services.
Risk Disclosure:
Futures and forex trading contains substantial risk and is not for every investor. An investor could potentially lose all or more than the initial investment. Risk capital is money that can be lost without jeopardizing ones’ financial security or life style. Only risk capital should be used for trading and only those with sufficient risk capital should consider trading. Past performance is not necessarily indicative of future results. Hypothetical Performance
Historical and Hypothetical results:
Historical and hypothetical performance results have many inherent limitations, some of which are described below. No representation is being made that any account will or is likely to achieve profits or losses similar to those shown; in fact, there are frequently sharp differences between hypothetical performance results and the actual results subsequently achieved by any particular trading program. One of the limitations of hypothetical performance results is that they are generally prepared with the benefit of hindsight. In addition, hypothetical trading does not involve financial risk, and no hypothetical trading record can completely account for the impact of financial risk of actual trading. for example, the ability to withstand losses or to adhere to a particular trading program in spite of trading losses are material points which can also adversely affect actual trading results. There are numerous other factors related to the markets in general or to the implementation of any specific trading program which cannot be fully accounted for in the preparation of hypothetical performance results and all which can adversely affect trading results.
Testimonials/Tweets/Comments:
Subscriber testimonials / Midnitebrands tweets appearing on this website may not be representative of other clients or customers and is not a guarantee of future performance or success.